
TA: Swing Failure Patterns
This is a MEMBER generated article by @Joel, come say hi to him in Discord and ask any questions! He wrote this and published to TradersBattle, taking inspiration from our very own ML Master trader.
What is a Swing Failure Pattern?
A Swing Failure Pattern (SFP) is a type of price action that signals a potential reversal in the market. Traders often use it in consolidation phases, ranging markets, or even in choppy conditions. Essentially, an SFP occurs when the price attempts to break a key support or resistance level but then fails to sustain the breakout, signaling that the move was a false breakout or a liquidity grab.
How Can This Save You? A Real Life Example
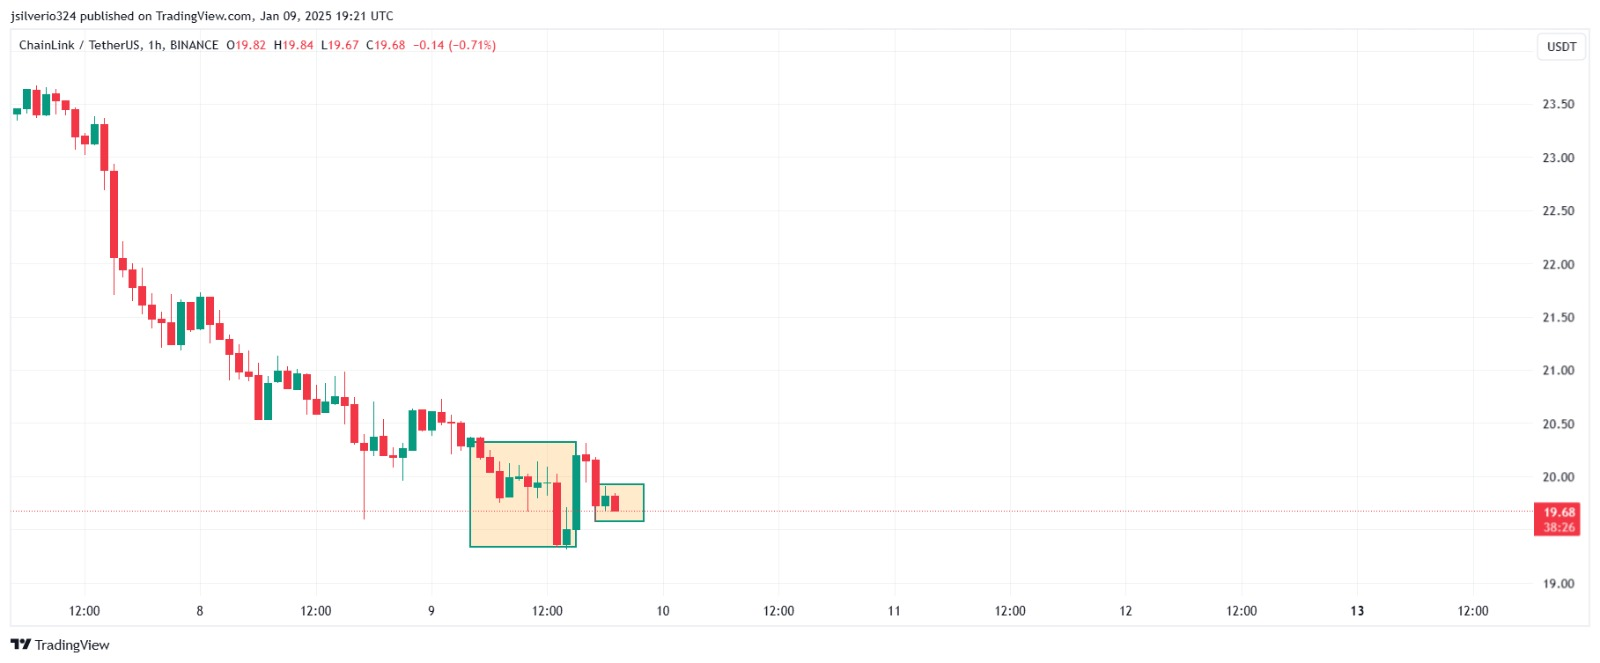
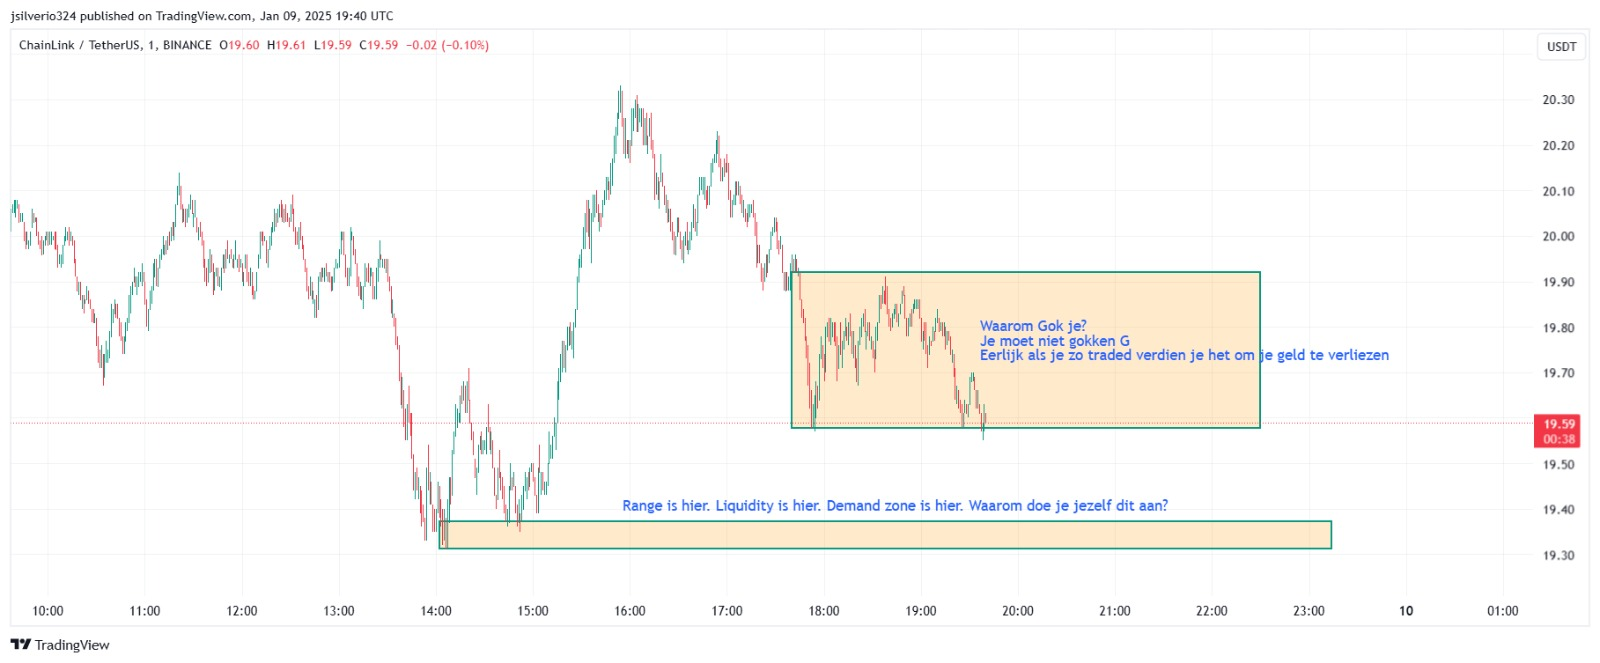
Here’s an example situation: Before fully understanding the concept of a Swing Failure Pattern (SFP), a trader entered a $LINK trade. As seen in the first profit card, he incorrectly assumed the market was about to reverse. The price broke the previous high and appeared to be retesting before moving higher. THIS IS NOT THE WAY!
This misjudgment triggered emotional decision-making, leading to revenge trading—a common pitfall in trading. The second profit card reflects this, showing how overtrading can spiral from frustration.
By Image 5, the trader began to realize the error in judgment. Instead of taking a SHORT position at the failed swing, he mistakenly waited for a LONG entry at a lower level. His Dutch notes highlight this reflection, capturing the lesson learned: identifying and acting on SFPs at the right moment is critical to avoiding unnecessary losses.
However, there’s a better approach, which we’ll explore below.
Image 1: LINK 15-Minute Chart on January 9 (16:00 – 21:45)
Images 2 & 3: Profit Cards
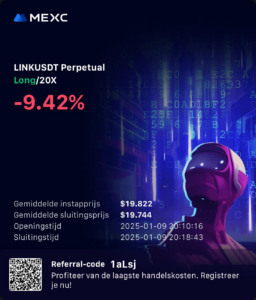
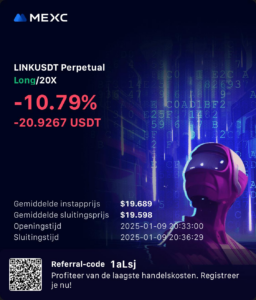
Image 4: $LINK trade if executed correctly based on the SFP
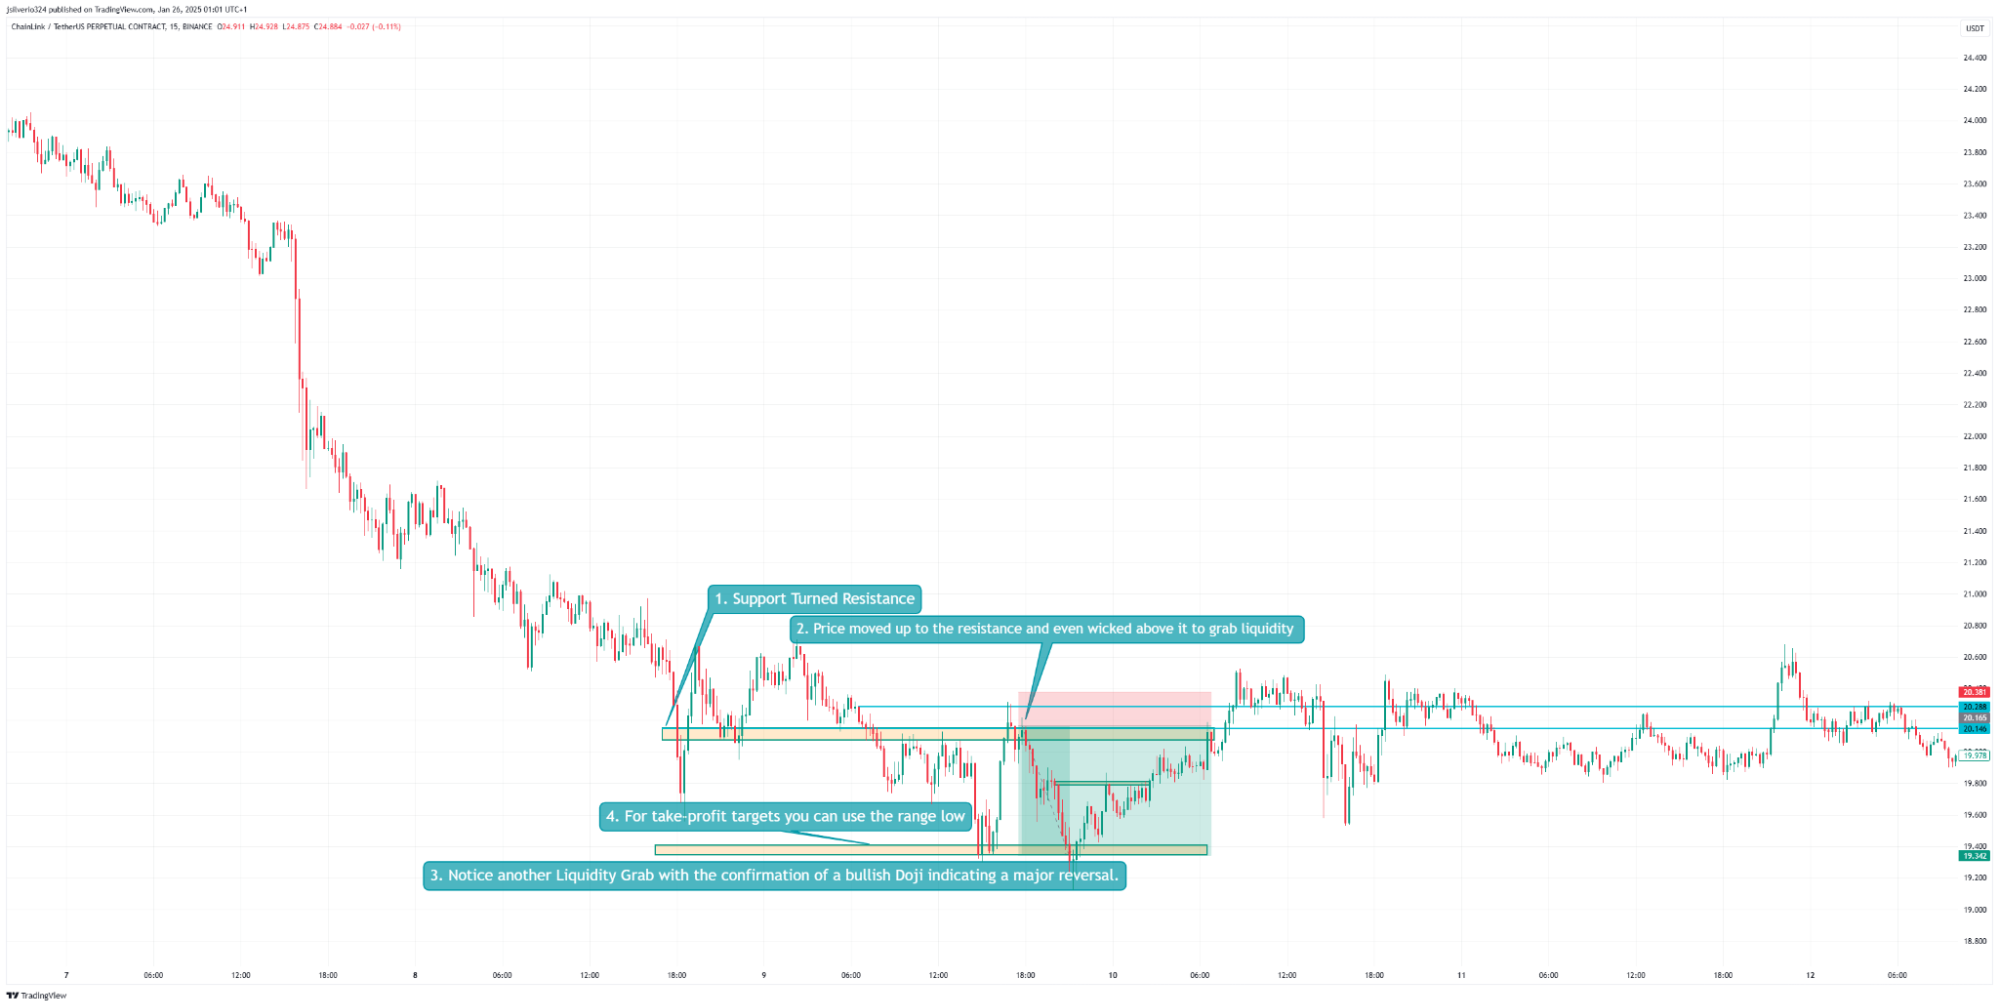
Image 5: Disillusioned trader before realizing that a Swing Failure Pattern even
existed
Short Setup
When the price fails to break above a resistance level and closes back below it, traders may enter a short position, expecting a reversal to the downside.
Key Characteristics
- The price action appears to break resistance but quickly reverses, failing to sustain the breakout.
- This often traps breakout-buyers while sweeping short-sellers’ stops at that level.
Image 6: Example of a Swing Failure Pattern – Short Setup
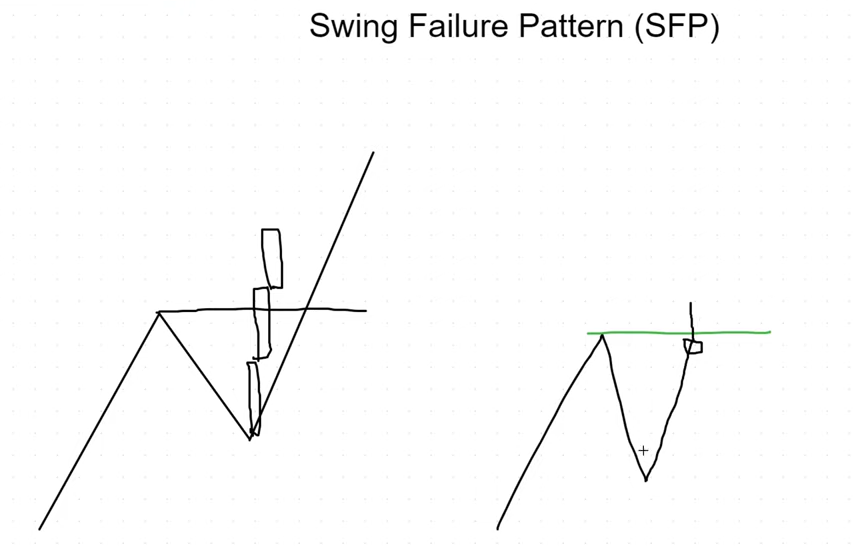
The price might give a momentarily breakout signal but is actually baiting breakout-buyers to enter while sweeping shorts at that level.
Spotting the Difference: Key Indicators
Take Image 1 as an example. We see a bearish morning star, a strong reversal signal. This pattern can help you determine whether the breakout is sustainable or likely to fail, making it a good opportunity to go short.
Other helpful candlestick patterns include:
- Bearish Engulfing
- Harami Patterns
- Bearish Three Crows
Indicators like the RSI or other momentum indicators can also help you identify weakening momentum. Essentially, when a candle wicks above the high but closes below it, it might indicate unsustainable price action.
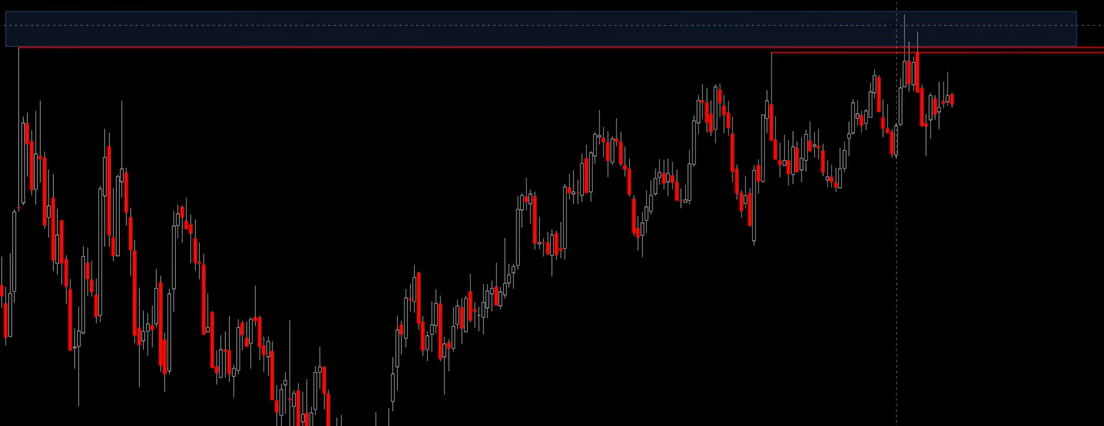
For example, see Image 7, which shows a Liquidity Sweep Swing Failure Pattern.
Risk Management
An SFP is a significant reversal signal, especially when combined with confluences like candlestick patterns or momentum indicators. If you encounter a Double Swing Failure Pattern, you can consider sizing up your position due to the higher probability of success.
Image 7: Liquidity Sweep Swing Failure Pattern – Short Setup
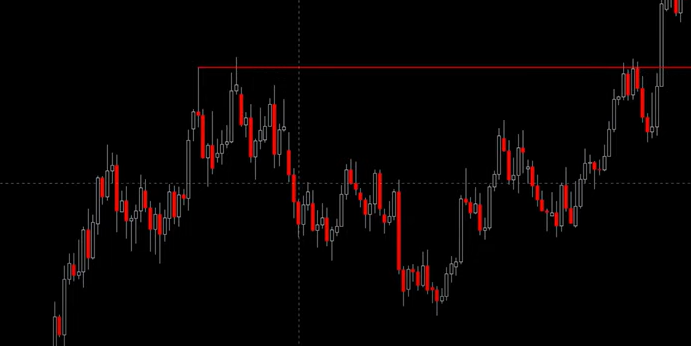
Image 8: Double Swing Pattern and Double Liquidity Sweep
Long Setup
Conversely, when the price fails to break below a support level and closes back above it, traders may enter a long position, expecting a reversal to the upside.
- In Image 9, the price wicks below a previous low and recovers above it, forming a double bottom with a bullish hammer candle.
- As shown on the right, the price subsequently moves to the previous high of the range.
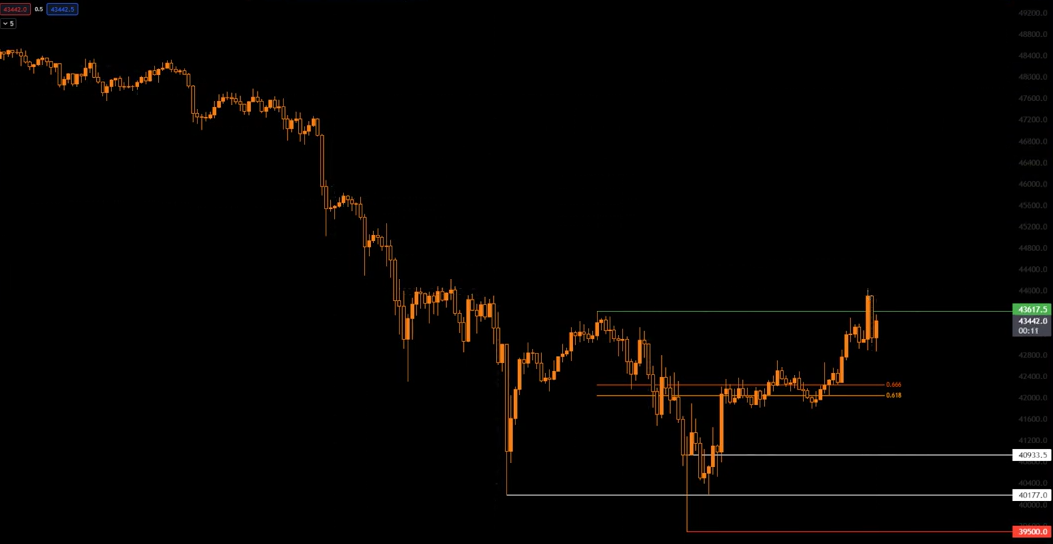
You can also incorporate Fibonacci levels to refine your entry. In Image 10, the SFP aligns with the Golden Pocket, increasing the likelihood of success.
Image 9: Swing Failure Pattern – Long Setup
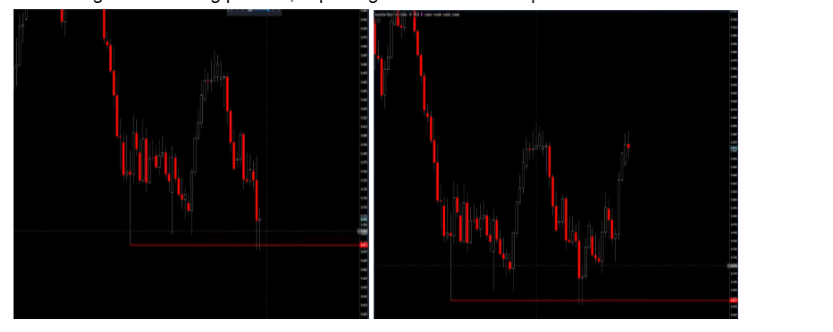
Image 10: Swing Failure Pattern with Fib levels – Long Setup
Conclusion
Swing Failure Patterns (SFPs) are powerful tools for identifying potential market reversals, but understanding how to spot them and act decisively is crucial. Whether you’re trading in choppy markets or looking for high-probability setups, SFPs can give you an edge when combined with proper risk management and confluences like candlestick patterns and momentum indicators.
The key takeaway? Don’t let emotions drive your trades. Revenge trading or second-guessing missed opportunities can cloud your judgment. Instead, focus on refining your strategy, learning from past mistakes, and embracing the lessons the market has to offer.
Remember: Mastering the art of SFPs can turn false breakouts into profitable opportunities. Be patient, stay disciplined, and let the market work for you—not against you.
Now, it’s time to take what you’ve learned and turn the next false breakout into your best setup yet!
Further Resources
For more on Swing Failure Patterns:
- Lincoln Nielsen explains how to use the Average True Range (ATR) for entries.
- Reuben Blamey FX Swing Points and Leg failures are clarified here. He also delves deeper into the confluences of multiple time frames such as a Swing Failure within another Swing Failure such as Weekly Swing Failures and Daily Swing Failures.
- Toros Crypto explores multi-timeframe confluences and Fibonacci retracements. He also dives deeper into the explanation of the Swing Pattern Failure through the ABC method.
- There is even an indicator which is used to identify Failed Swing Patterns by LuxAlgo.
- For the systematic trader, the post on TradingView might be more to your taste as it gives the technical settings for your Supercharts.
@Joel


