
Real and Fake Breakouts
Greetings, Frens!
Welcome to this exciting article, where we’re going to unlock the secrets to identifying real breakouts in the trading world. If you’ve ever been caught in the frustration of chasing what turned out to be a fake breakout, you’re not alone—but worry no more! By the end of this read, you’ll not only master the art of spotting real breakouts but also gain the confidence to steer clear of the traps set by fake ones.
Whether you’re a seasoned trader or just starting out, this strategy will serve as your compass in navigating volatile markets. So, grab your favorite drink, settle in, and let’s dive deep into the mechanics of spotting real opportunities!
Ready to sharpen your trading edge? Let’s get started!
During a bull market, when altcoins are breaking their previous highs, many traders find themselves puzzled by two key questions:
- Is this a real breakout?
- Is it a deviation?
So, what should a trader do in such a situation? Worry not, because AR is here to guide you with a proven strategy to distinguish between real and fake breakouts using two powerful indicators. This strategy adds to our trading toolkit, recognizing that crypto markets are highly volatile. While no strategy is foolproof, especially in the face of fundamental events, this approach aligns
closely with market sentiments, making it incredibly effective.
Indicators Used in This Strategy:
- OBV (On-Balance Volume)
- Aggregated Open Interest
The Strategy: What to Look For
- Identify market highs.
- Observe the price breaking those highs.
- Analyze OBV and Open Interest (OI) behavior:
- Bullish Breakout Confirmed:
If the price, OI, and OBV all break their respective previous highs, it confirms a strong bullish breakout. - 50/50 Bullish Signal:
If the price and OI break out, but OBV does not, the signal is less reliable and indicates mixed sentiment. - Fakeout Alert:
If the price breaks out but neither OI nor OBV confirm the breakout, it’s likely a fakeout.
- Bullish Breakout Confirmed:
- A rising Open Interest often signals that stop-losses and liquidations will being hit, suggesting the trend will continue until most positions are cleared.
Example 1:
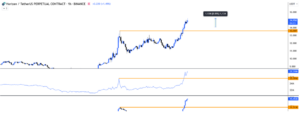
Here’s a recent example with $ZEN:
On the lower timeframes (LTF), we observed the price breaking out, accompanied by OI and OBV also breaking their previous highs. This alignment of all indicators confirms a strong bullish breakout, indicating that the price is likely to continue rising.

Here you can see the price continuing to rise:
Example 2:
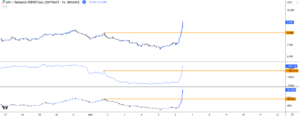
Another example is $UNI. Here, you can see a significant breakout where all the metrics—price, OI, and OBV—are breaking out. This confirms a strong bullish signal, indicating the price is likely to continue rising.
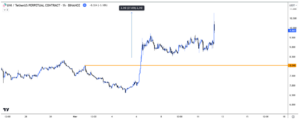
Here’s the result: as you can see, $UNI rose by 55% after the breakout. This confirms it was indeed a real breakout, which was easily identifiable using the strategy. Additionally, notice the level where the breakout occurred—supported by all the metrics breaking out. This level later became a strong support and marked the bottom.
Example 3:
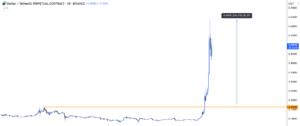
This is one of the best examples of a real breakout. As you can see, all the metrics—price, OI, and OBV—are breaking out simultaneously, confirming the strength of this move.

After that, XLM rallied an impressive 3.5x! This highlights the importance of identifying real breakouts during altseason. By closely monitoring OBV and OI, you can make informed decisions and capitalize on such opportunities. It’s a wise strategy to consider buying spot positions when a genuine breakout is confirmed.
Example 4:
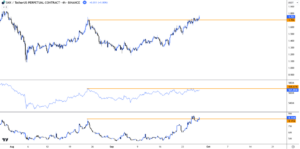
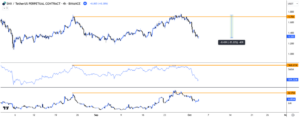
Here’s $SNX: You can see the price attempting to break its previous high, but OBV and OI are lagging behind. This indicates that the breakout could be a fakeout, so caution is warranted. To capitalize on the fakeout, wait for the price to deviate above the previous high. Once the price drops back below the previous high, it provides a clear opportunity to enter a short position.
As predicted, the price dropped by 25% after the fakeout. This highlights the effectiveness of identifying lagging OBV and OI to anticipate such moves and make profitable decisions.
By closely monitoring these two metrics—Open Interest (OI) and On-Balance Volume (OBV)—you can effectively distinguish between real and fake breakouts, enabling you to capitalize on market opportunities with confidence.
Congratulations on adding another powerful tool to our learning arsenal!”


