
TA Basics: Point of Control
Point of Control (POC)
In this article I will be showing you guys a unique way that I use the fixed range volume profile tool on tradingview and how it helps map out areas of support, resistance, and helps deliver sniper entries! I will teach you what a POC is, why it works, how to find it, and how to use it in tandem with your other confluences to level up your trading!
What is a Point of Control? (POC)
A POC is a price point within a range at which there was the most trading volume and price was the most balanced. Another way of looking at it is that the POC of a range represents the dominant price within that range. This is important because even after price breaks out of the range, if it returns to that range, there are often lots of outstanding orders near the POC, so these levels provide great entries and can act as support and resistance!
How to find the POC of a range
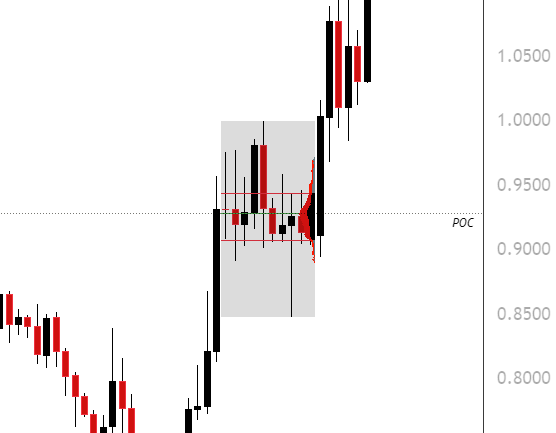
The POC of a range is found by using the Fixed Area Volume Profile tool on TradingView. To find the correct POC, you should find an area where price has been consolidating between impulsive moves in either direction, and don’t include the large candles, only the range that forms between the big moves!
Here is an example:
How to use POC in your trading
If you remember from the introduction lesson for confluences that I posted, finding confluences on high timeframes is much more powerful than low timeframes. With POC’s I only use the POC of range formed on the 1 day or 3 day chart, and on occasion I will use the 4 hour chart, but I try to find them more often on D1 and D3. This is simply because using lower timeframes with this would result in dozens or hundreds of POC levels and would make reading the chat overly complicated.
To use POC’s they can be good entry levels if you find them within your optimal entry zone, whether that be a FVG or a fib retracement level of interest. They can also be used as indicators of market structure change or invalidation. If there is a POC or group of POC levels, and a candle closes below them with strength, it can be a good indicator of a further move down, and if a candle closes with strength above a strong POC, it can be a good indicator of an upwards trend starting.
You can determine if the POC that you found is valid based on historical price action. In my strategy, POC levels never expire, you can see POC levels from ranges that formed 2 years ago still hold significance today, and if you look at how price historically reacted off of this level in the past, you can determine if it’s a strong POC, a weak one, or if you simply mapped it out wrong and there’s no significance whatsoever. I usually look for price reactions off of the level and see what happens after a candle closes past it. And it doesn’t always react perfectly, but often it is significant.
Here is the future price action off of the POC that I mapped out in the last example, weeks later!
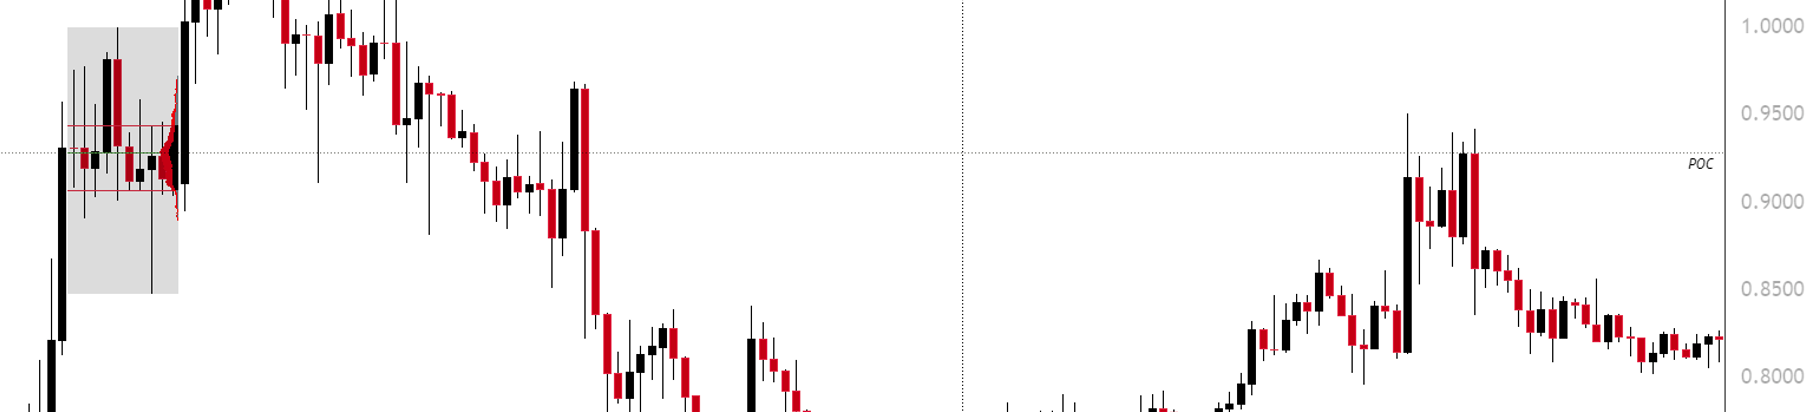
Notice how candles broke above it, but failed to close above it, and price continued down as a result! Combined with other confluences, it is entirely possible that we could have used this POC as an entry for a short on this chart.
————–
Sometime next week or on a few occasions in the future I would love to do a livestream showing you guys in real time, how to master POC’s because they do take some practice to get right.
A also am aware that I am one of the only people that uses the Fixed Range Volume Profile tool this way, and while it does work, other ways of using it aren’t inherently wrong. Our very own ML Master, uses this tool completely different than I do, and it works well for him!
As always, thanks for taking the time to read this, and I hope you got something of value out of it! Reach out with any questions if you need!


